#1 Finance App 4.8 ★ across 300+ reviews
Know exactly
where it goes.
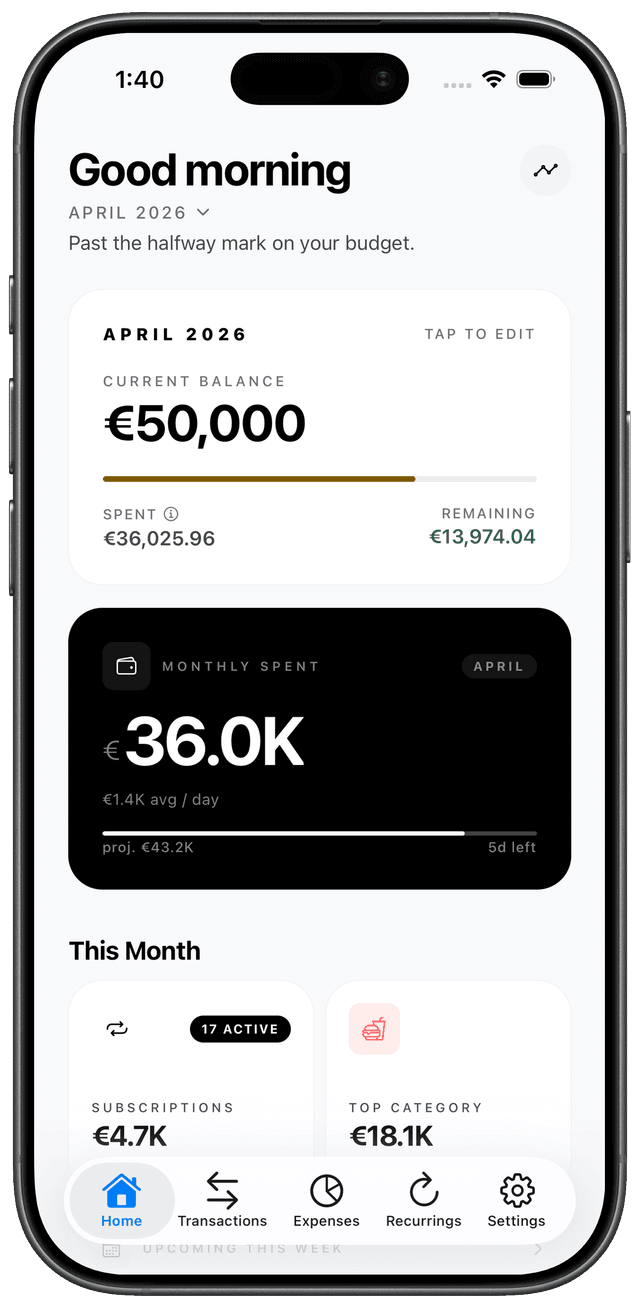
In CentRail you can categorize every expense and gives you honest insights into where your money really goes.
Sound familiar?
Where did all my money go this month?
Still paying for subscriptions I forgot I had.
Every month looks the same — until it's quietly worse.
Money between friends always turns into awkward math.
CentRail answers every one of these — clearly and instantly.
The full loop of your finances — in one place.
A personal finance app built with React Native / Expo. It covers logging expenses, watching trends, managing subscriptions, and comparing months to understand behaviour changes over time. It also handles the social side of money — tracking what people owe you and what you owe them.
Compare months side by side
See the biggest movers, new categories, and cumulative spend curves to understand how your behaviour changes over time.
Subscriptions, finally visible
Dedicated recurring tracker with upcoming-payment alerts and a share-of-spend breakdown for every month.
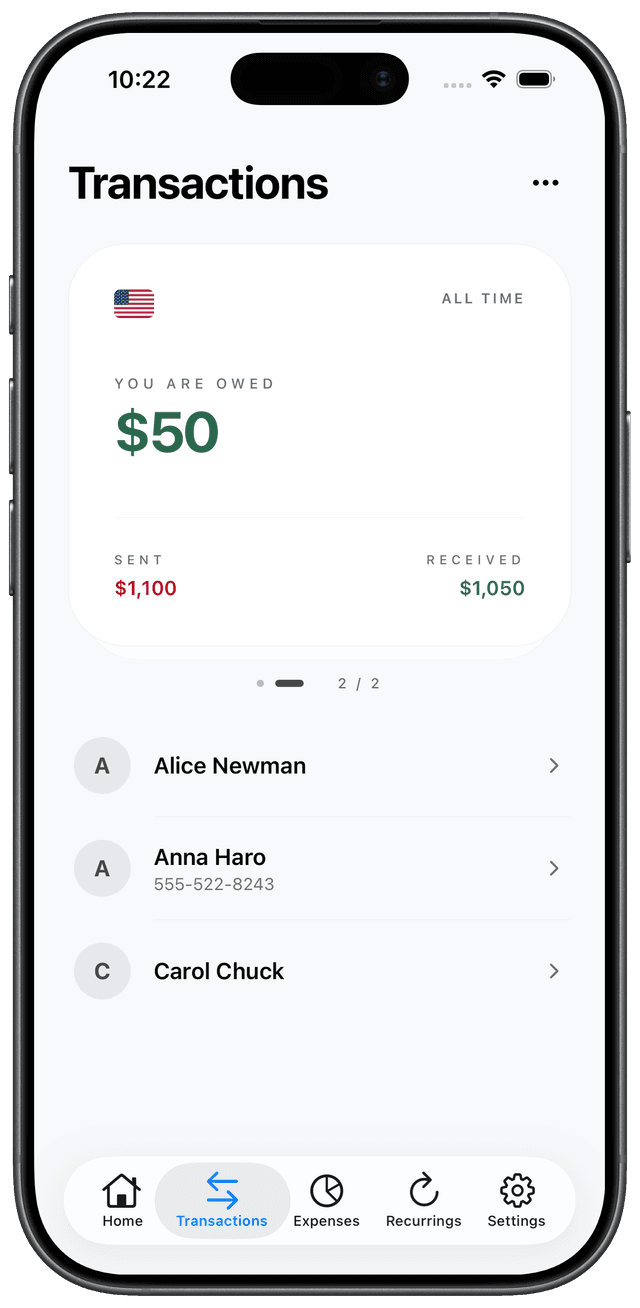
Money between people, sorted
A full transaction ledger to track what friends or clients owe — with per-customer history and Excel export built in.


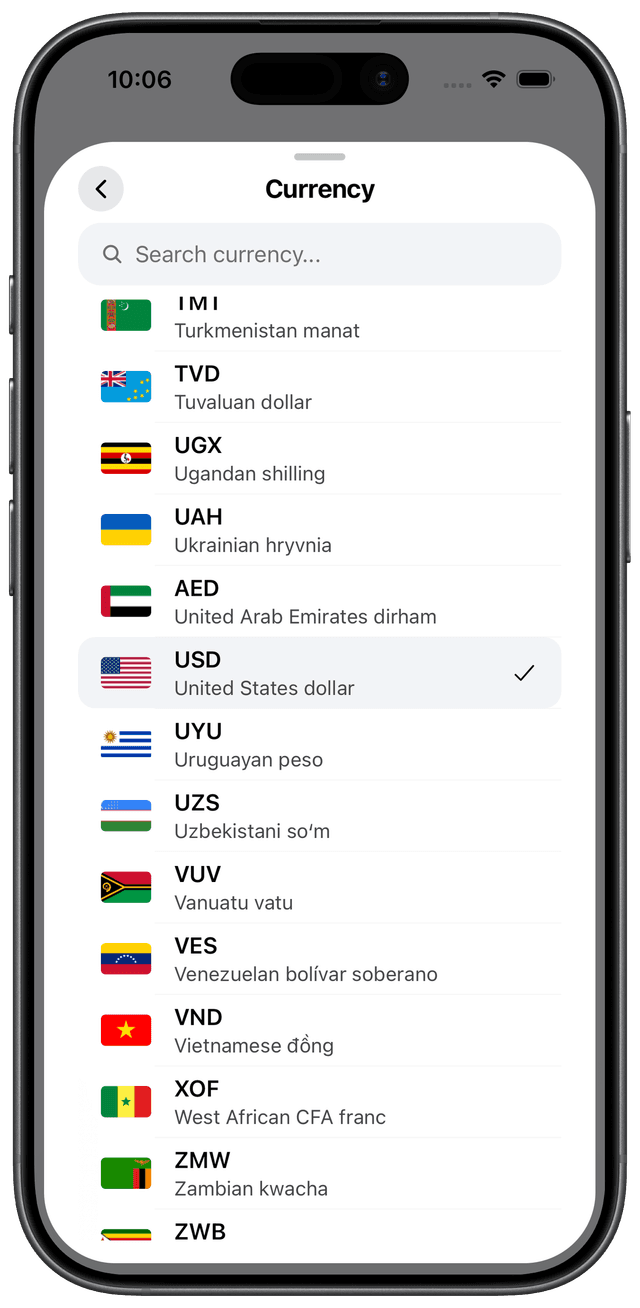
Multi-currency, built in.
Log expenses in 150+ currencies with live exchange rates. A built-in converter and home-screen currency carousel keep everything in sync.
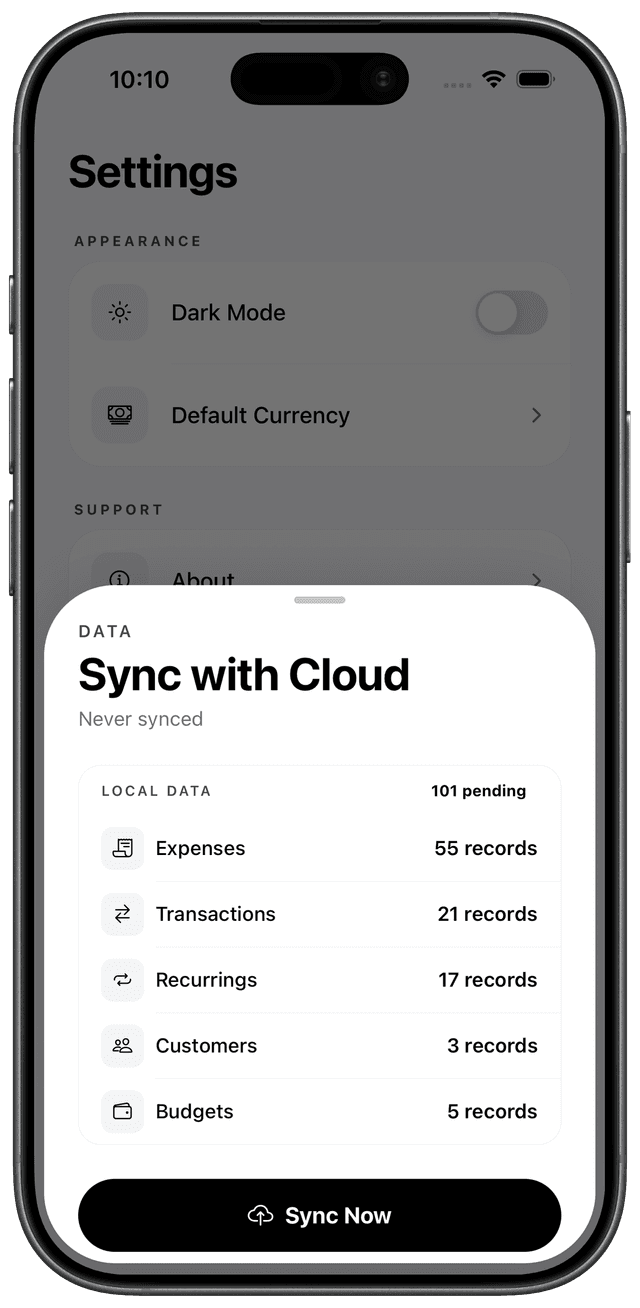
Cloud sync, on your terms.
Offline-first: all data lives on your device. Create an account and sync manually whenever you want — your data moves only when you say so.
Your money, finally
making sense.
Become the most aware person in the room
Every expense logged your way, every trend surfaced, every subscription tracked — all in one app that gives you the full picture.
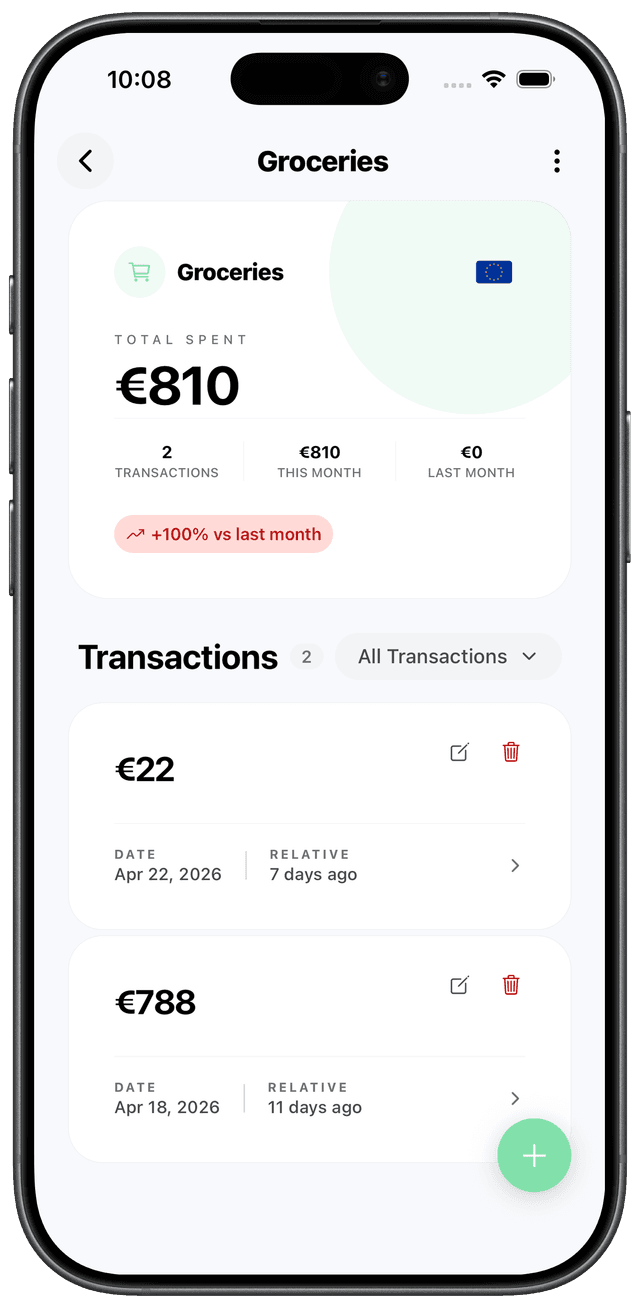
Instant expense logging
Pick a category, enter an amount — logged in seconds. Every expense goes exactly where you put it.
Trends you can act on
Monthly comparisons, biggest movers, and cumulative spend curves make patterns impossible to miss.
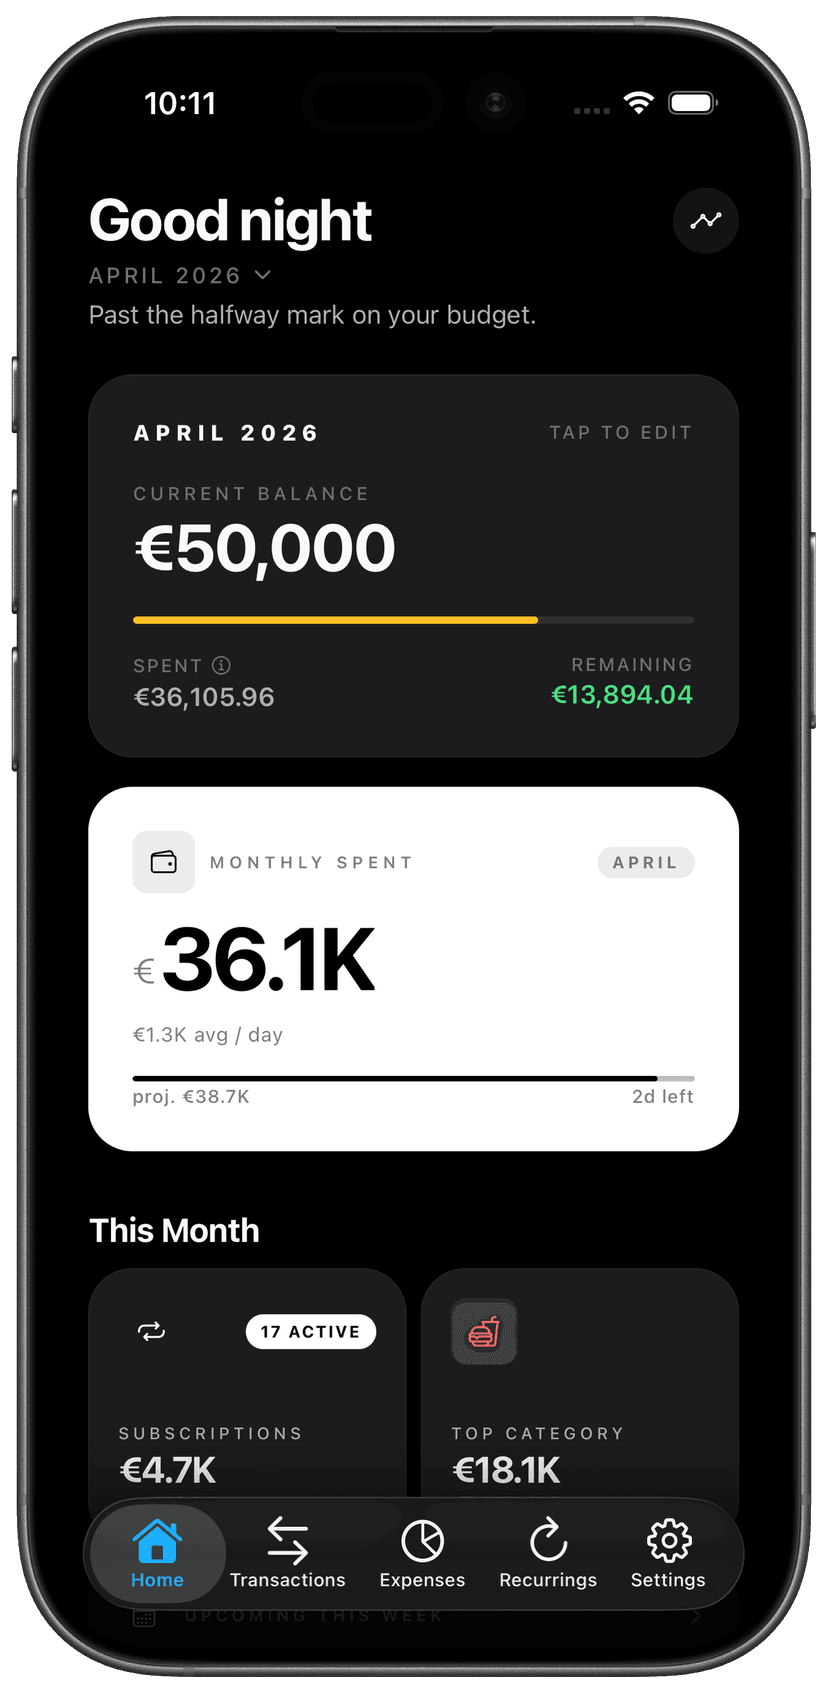
Budgets that hold
Live progress per category with a warning banner the moment you're close to your limit.
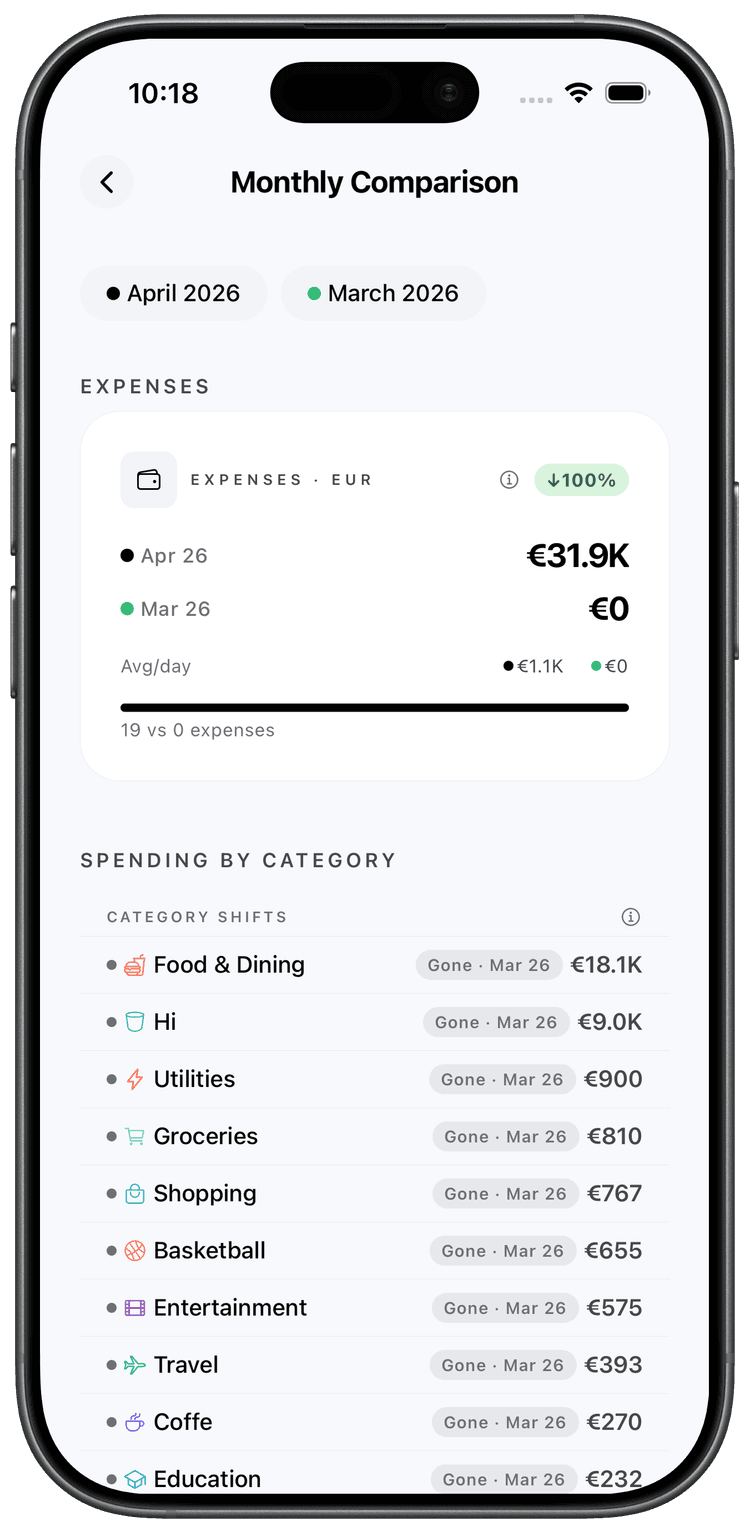
Monthly comparison
Not just totals.
Understand the shape.
Most apps tell you what you spent. CentRail shows you how your spending changed — category by category, day by day, subscription by subscription.
Six comparison lenses
Overview, transactions, category shifts, recurring costs, biggest mover, and a cumulative sparkline — all in one view.
Biggest mover, surfaced instantly
See which category changed the most in absolute and percentage terms — no manual digging required.
Day-by-day sparkline
Two cumulative curves overlaid so you see exactly when one month overtook the other.
$3,210
Total spent
+$370
52
Transactions
+5
$107
Daily avg
+$15
Spending by category
Food & Dining
FAQ
Frequently
asked questions
Everything you need to know about CentRail. Can't find the answer? Reach out to our team.

Stop guessing.
Start knowing.
Every expense logged your way, every trend surfaced, every month understood. CentRail turns your spending into something you can actually act on.